Capturing Errors
Learn more about how Sentry captures unhandled and handled errors and how you can enrich your event data.
Once initialized in your code, the Sentry SDK will capture various types of events and notify you about them in real-time, depending on the alert rules you've configured. With the Django app already running on your localhost, let's try them out.
If you're using your own source code, follow the instructions in Getting Started to introduce an error into your app.
The Sentry SDK will automatically capture and report any unhandled error that happens in your application runtime without any additional configuration or explicit handling. Generally, unhandled errors are errors that aren't caught by any except (or try/catch) clause.
In your browser, launch the local Django app in the following endpoint to trigger an unhandled error:
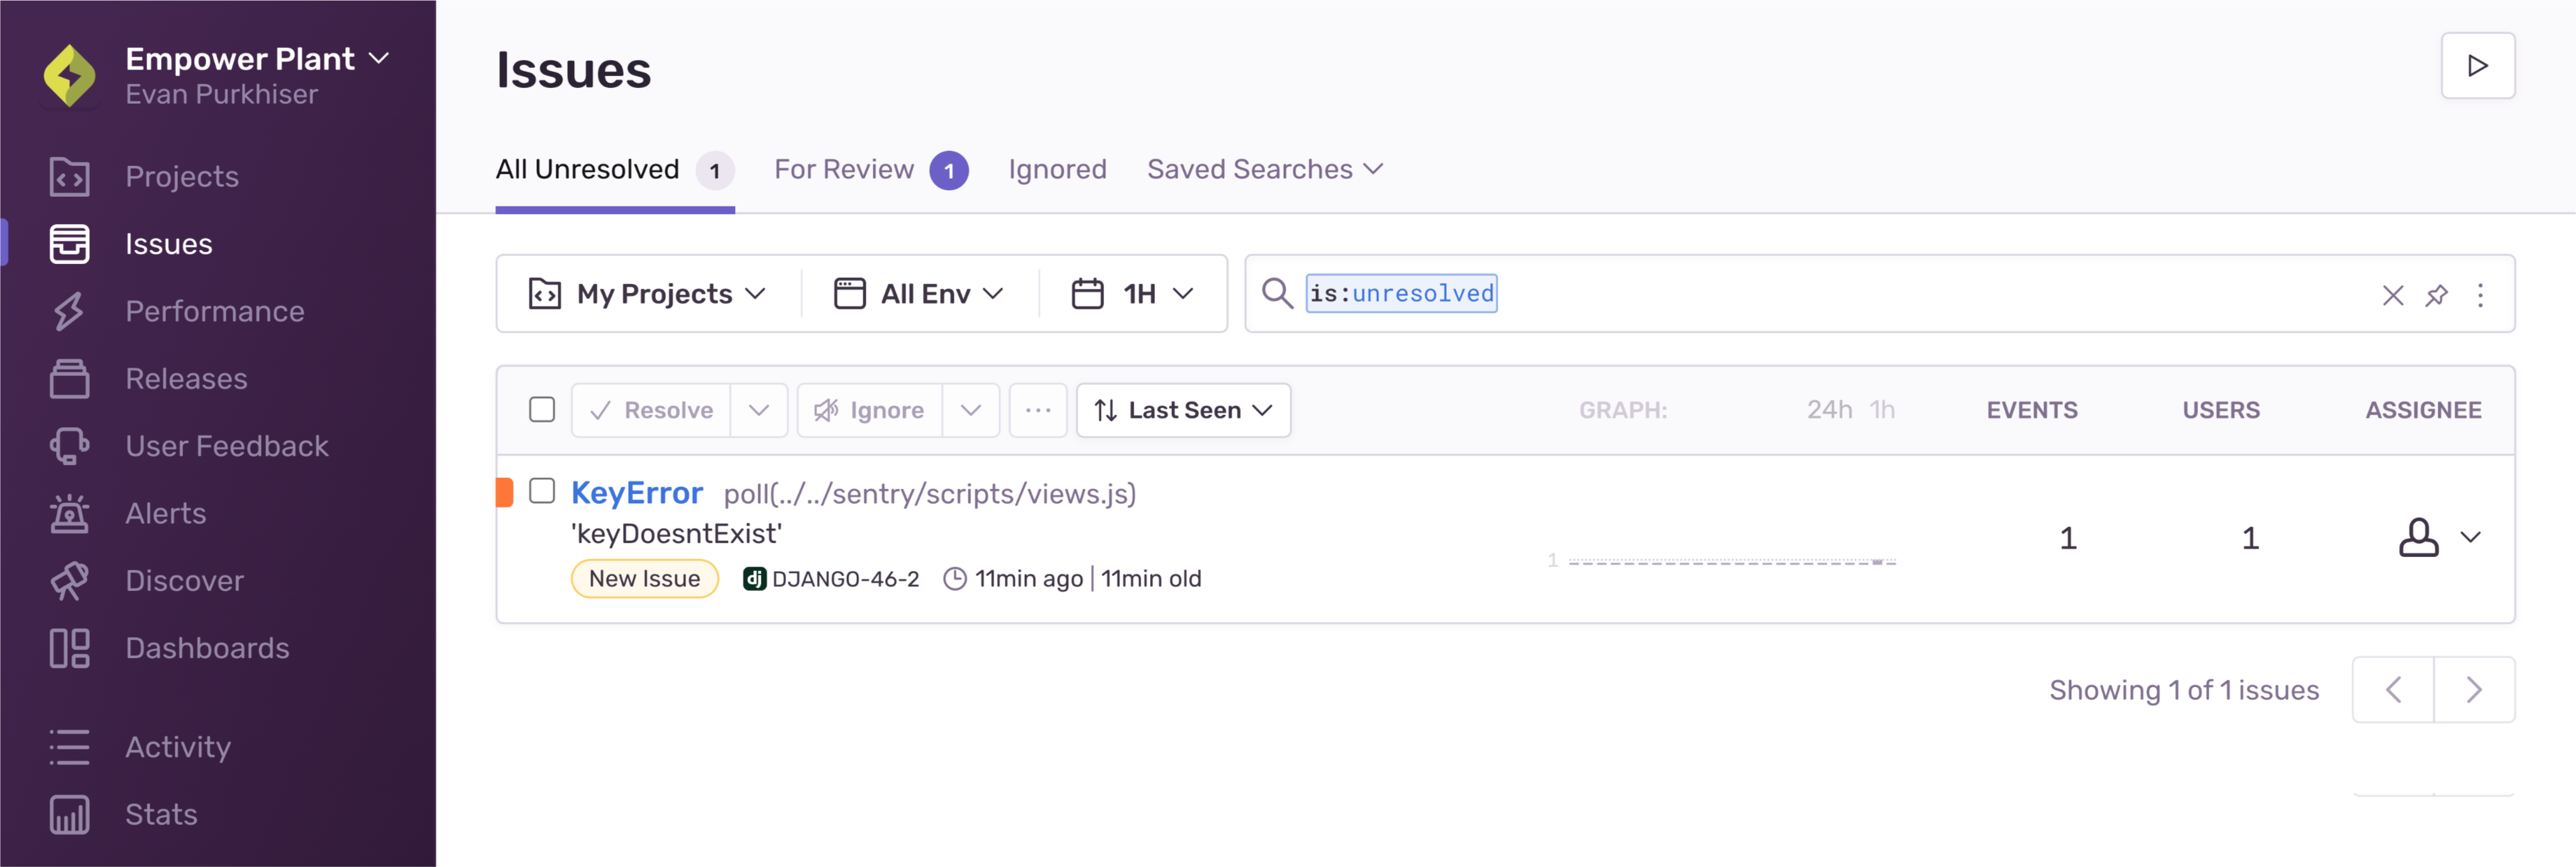
http://localhost:8000/unhandled.If you've set up an alert rule, you should be notified about the error. Otherwise, open the Issues page in your Sentry account.
Notice the unhandled exception appears in the list of issues.

Click on the issue, to open the Issue Details page.

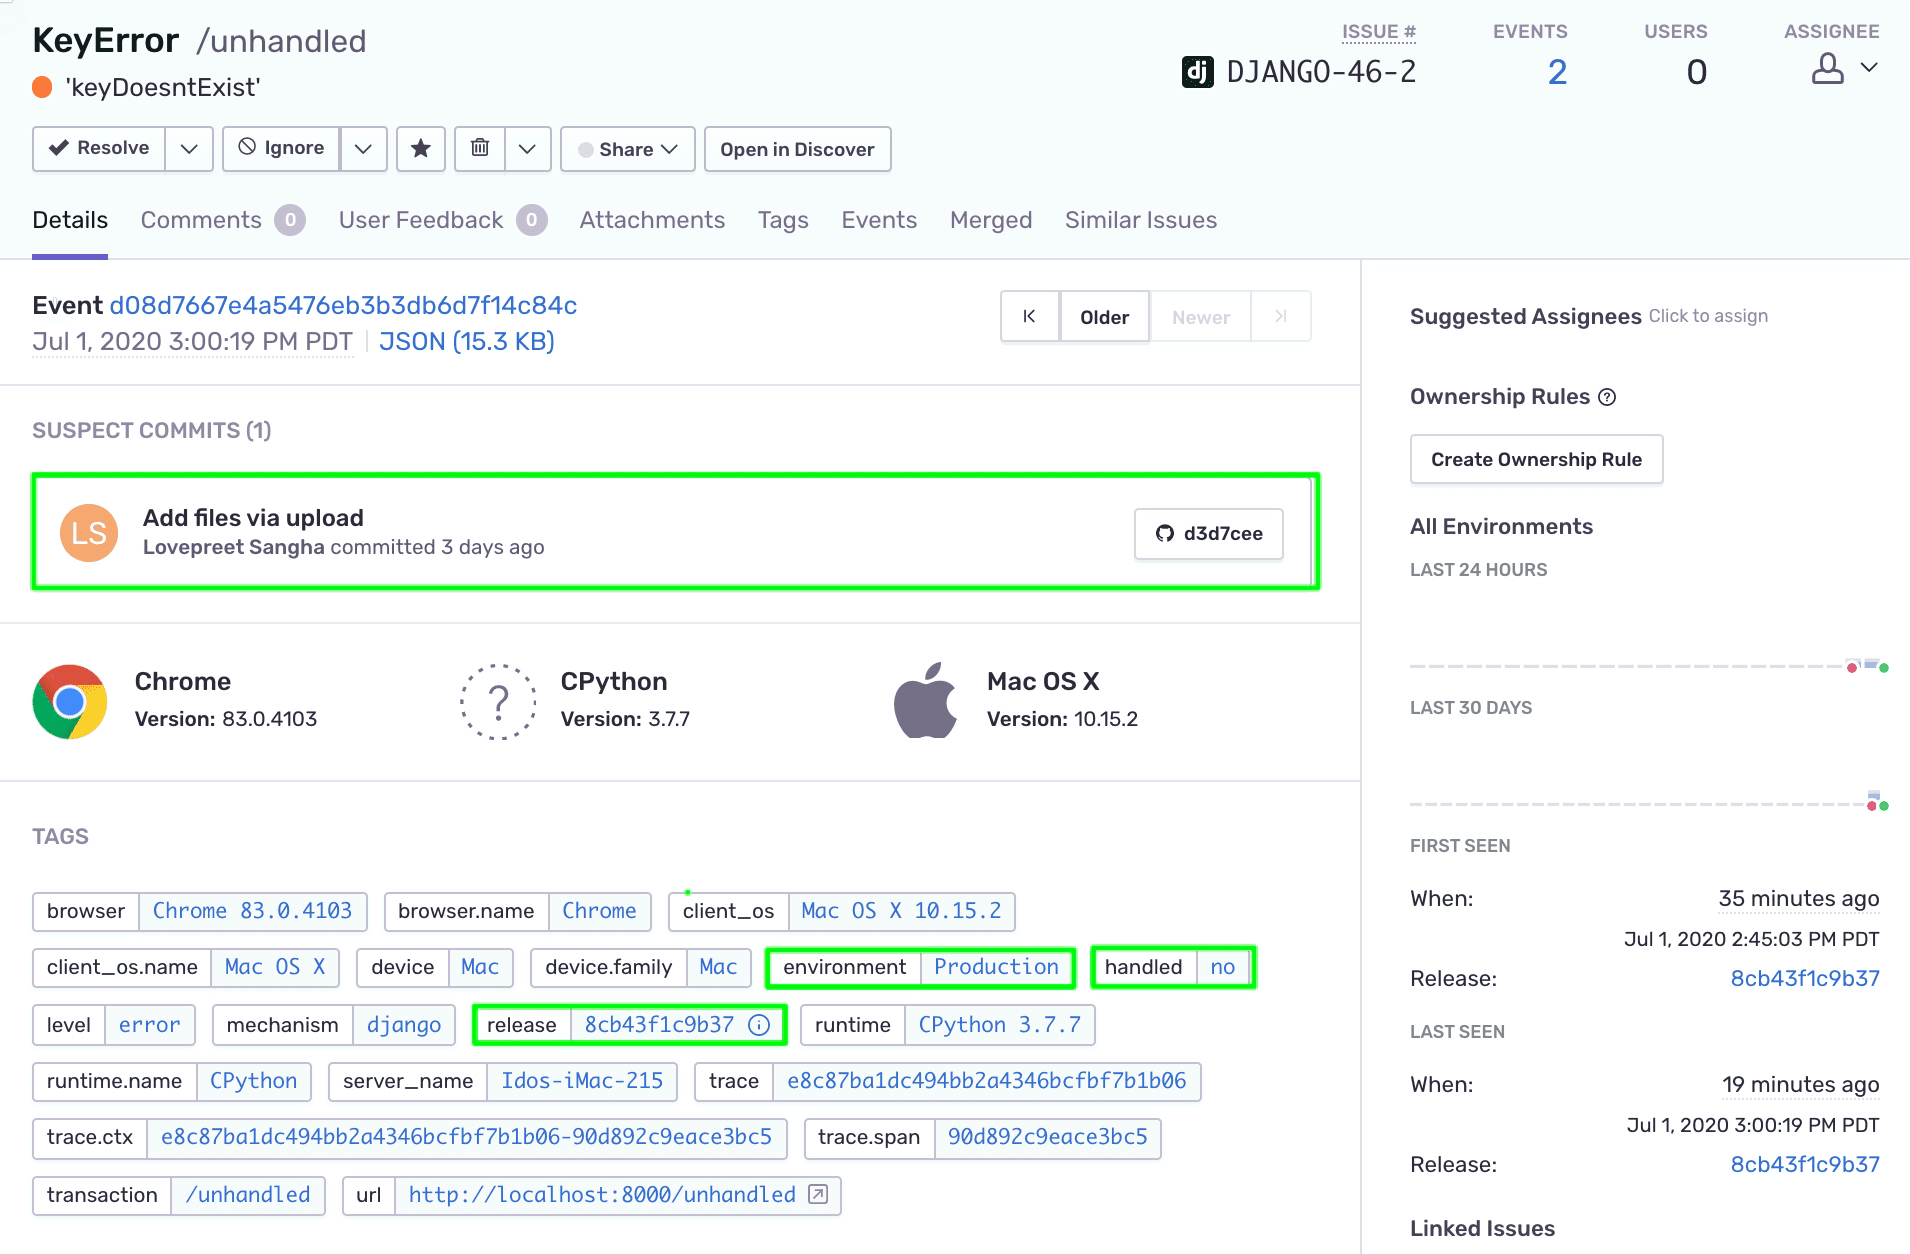
Notice that the event:
Is tagged with the
environmentandreleaseoptions we've set in the previous tutorial andhandled:no, marking this event as an unhandled errorContains a suspect commit, made possible because of the commit tracking feature we enabled previously
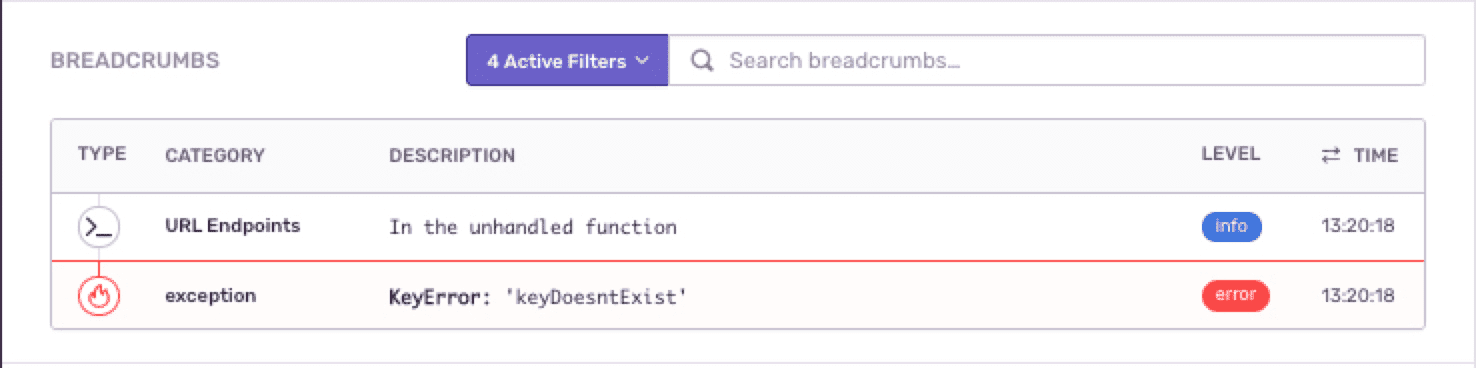
Contains the custom breadcrumb we added through the SDK

The Sentry SDK contains several methods that you can use to explicitly report errors, events, and custom messages in except clauses, critical areas of your code, and so on.
Open the
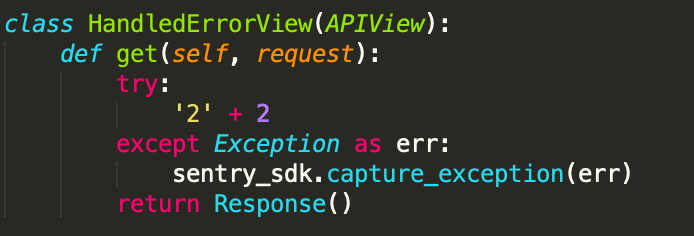
views.pyfile. Notice that we importsentry_sdklib which contains thecapture_exceptionmethod:Copiedimport sentry_sdkThe method is used to capture the exception handled by the except clause in
HandledErrorView:
To try it out on your localhost, trigger the following endpoint:
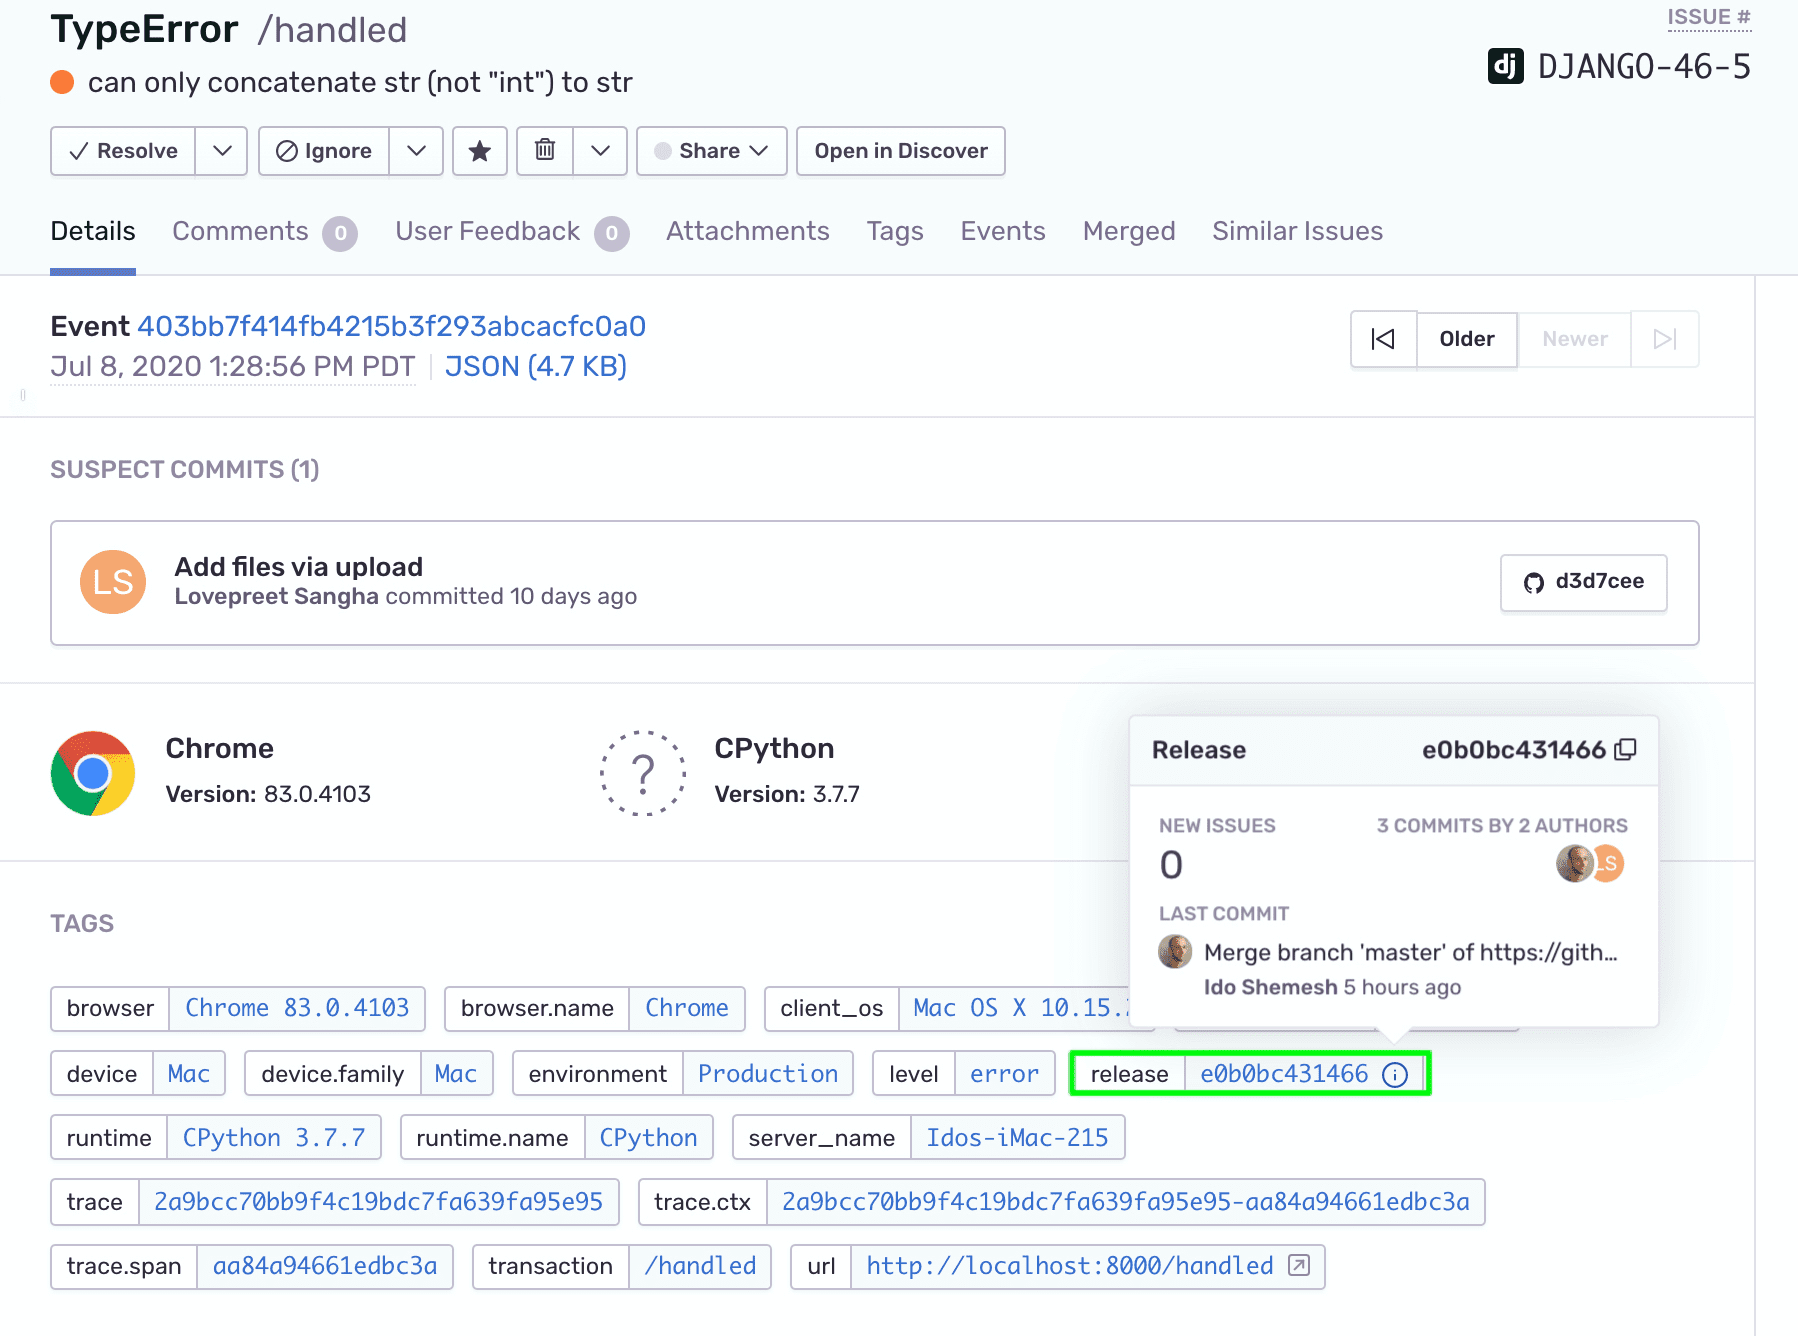
http://localhost:8000/handled.Similar to what we did with the unhandled error, open the new issue's detail page.
Notice that the event is tagged with the same
environmentandreleaseconfiguration options. Hover over the "i" icon in the release tag to reveal the release information and the commits associated with it.
Click on the release's "i" icon to navigate to the release page.
Typically, capture_message is not emitted, but there are times when a developer may want to add a simple message within their app for debugging purposes, and capture_message is great for that.
In the
views.pyfile, thecapture_messagemethod is made available through thesentry_sdklib import.You can use it anywhere within your app. In our example, we've created a dedicated view class,
CaptureMessageView, to trigger and capture a message we want to track:Copiedsentry_sdk.capture_message("You caught me!")To try it out on your localhost, trigger the following endpoint:
http://localhost:8000/message.As before, open the new issue’s detail page from the Issues page.

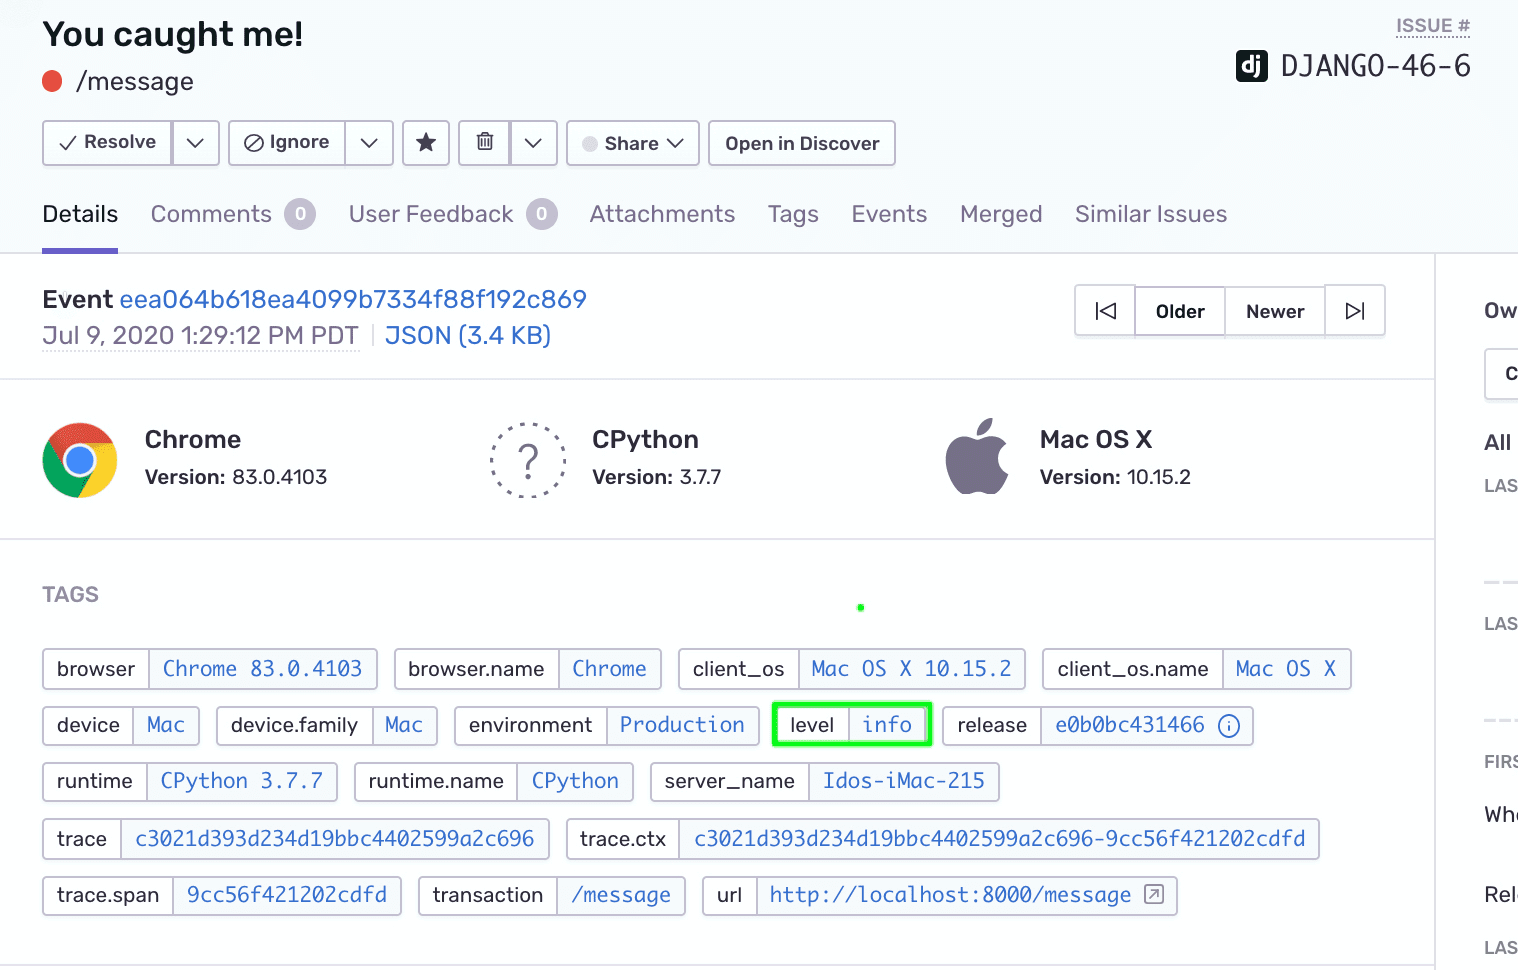
By default captured messages are marked with a severity level tag
level:info, as reflected in the tags section. However, thecapture_messagemethods accept an optional severity level parameter.In the
views.pyfile, change thecapture_messagemethod to:Copiedsentry_sdk.capture_message("You caught me!", "fatal")Save the changes and trigger the
/messageendpoint again. Changes should be applied immediately throughStateReloader.Notice that the severity level tag on the new event now shows
level:fatal.
You can enrich your event and error data through the Sentry SDK by adding custom tags and user context attributes. In addition to providing more context to your errors, those will expand your options to search, filter, and query through your event metadata. Learn more about the advantages of enriching your data in Event Data.
To enrich the data of the message events we've captured with capture_message:
In the
views.pyfile, locate the line that triggerssentry_sdk.capture_message.Replace that line with the following code:
Copiedwith sentry_sdk.push_scope() as scope: scope.set_tag("my-tag", "my value") scope.user = { "email" : "my.email@your.domain.com" } scope.set_extra("someVariable", "some data") sentry_sdk.capture_message("You caught me!", "fatal")We're using the
push_scopemethod that allows us to send data with one specific event on a local scope. We're setting a custom tag, user context attribute (email), and extra data on the local scope to enrich the data on the message event.Save your changes and trigger the
/messageendpoint again.Open the issue’s detail page from the Issues page.
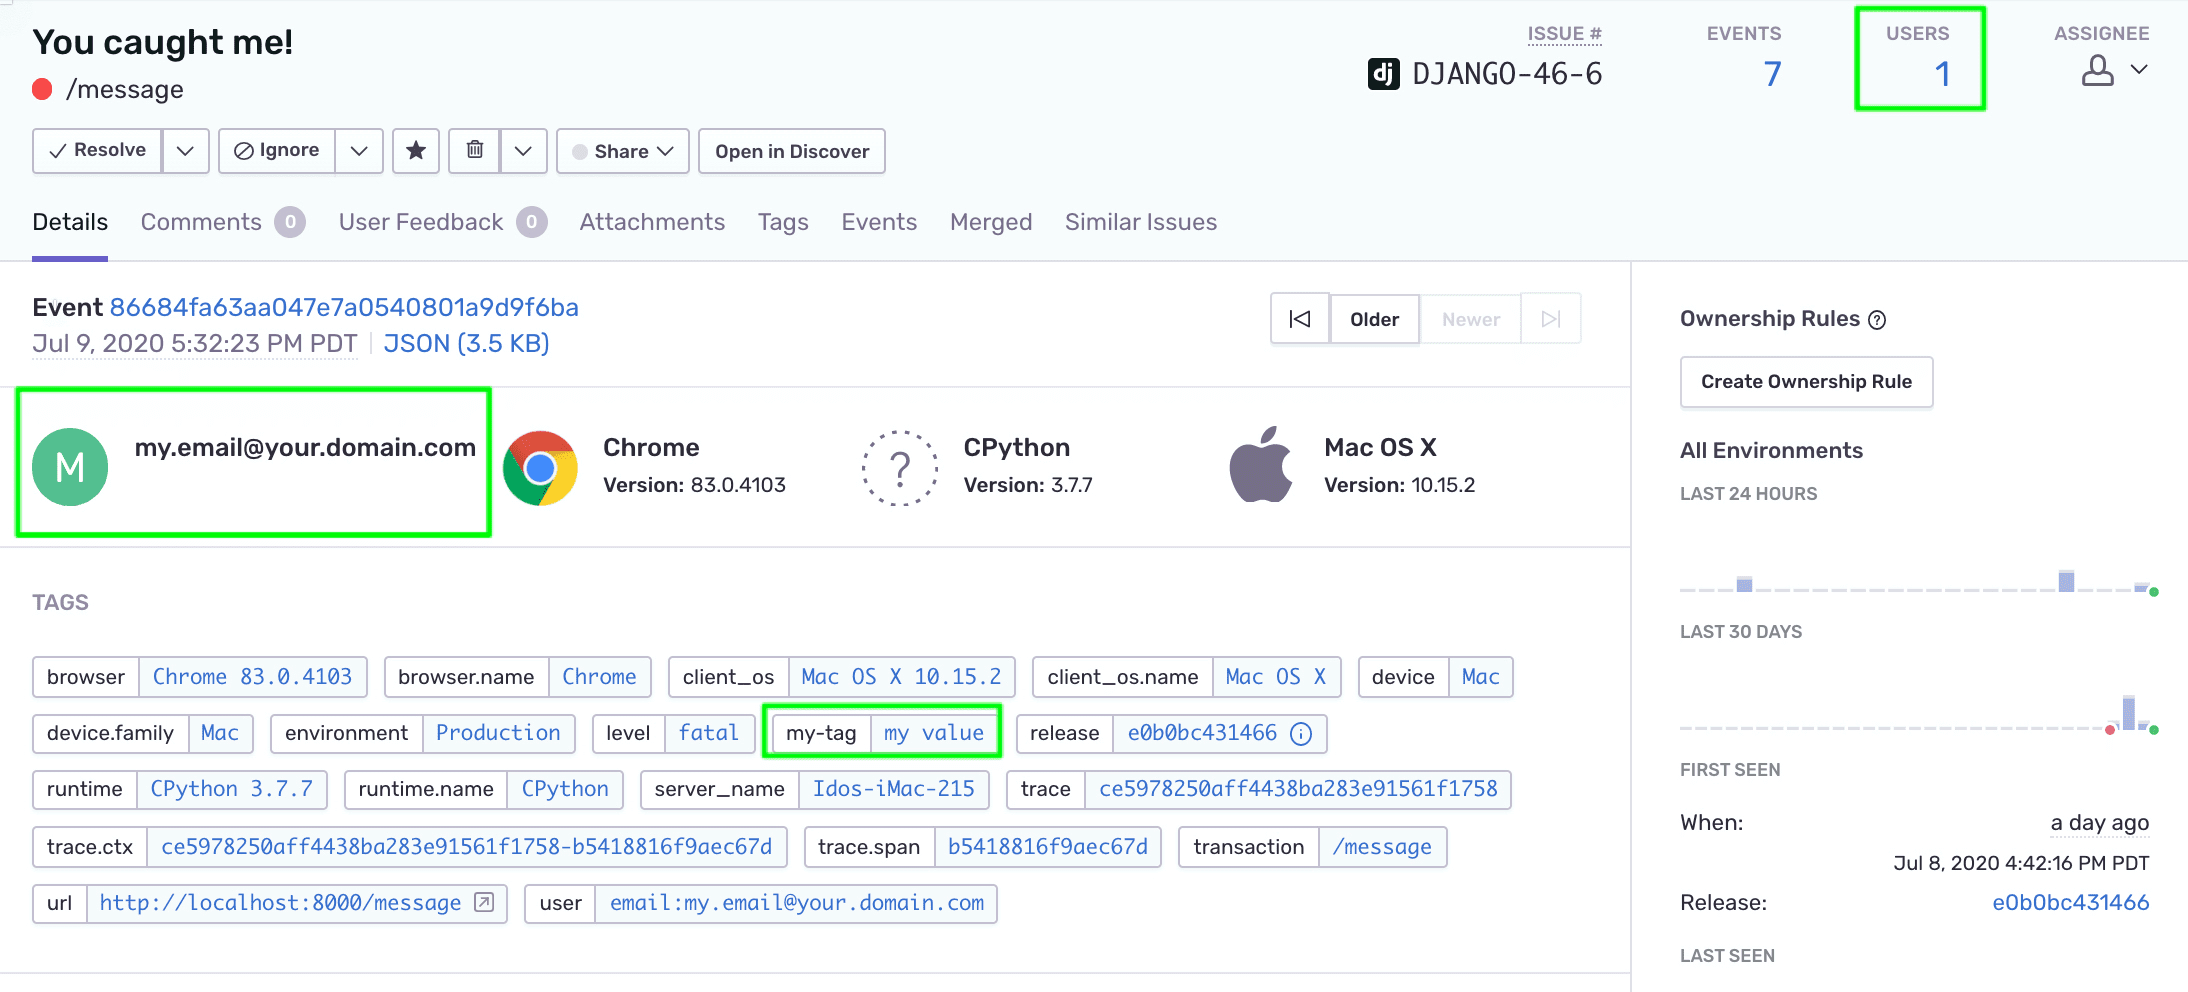
Notice that:
The user email is now displayed on the details page and the number of unique users impacted by this event is reflected in the issue's header.
The custom tag is now available (and searchable) in the list of tags.

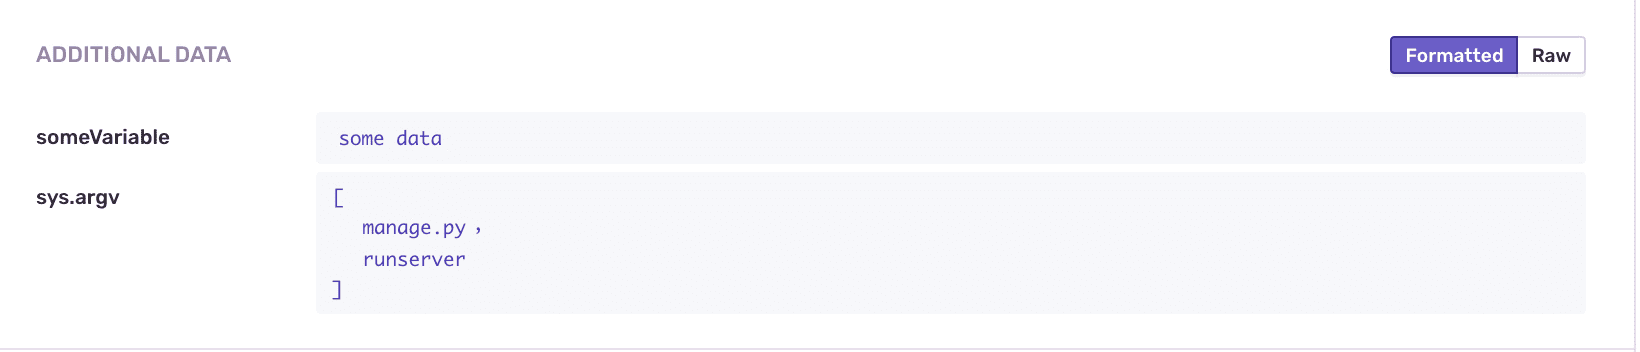
The extra data we set on the SDK is reflected in the "ADDITIONAL DATA" context.

Our documentation is open source and available on GitHub. Your contributions are welcome, whether fixing a typo (drat!) or suggesting an update ("yeah, this would be better").